Day 1, Monday, October 17, 2016 |
REGISTRATION
8:00-9:00am • Room: Independence Foyer
BREAKFAST
9:00-9:15am • Room: Independence A
Conference Chair Welcome Remarks
9:15-10:00am • Room: Independence A
KEYNOTE
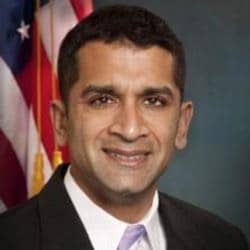
21st Century Data-Driven Environmental Protection
A key challenge of today's federal government is to ensure that data and evidence are used to inform regulation and policy decisions. Data-driven decision making uses analytics techniques to transform data into information and, ultimately, actionable knowledge. Data science is the connective tissue between the analytical platforms and data-driven decision making. Robin Thottungal discusses the analytical approaches that support the EPA's mission of protecting the environment and human health.
10:00-10:30am • Room: Independence Foyer
BREAK
10:30-11:20am • Room: Independence GHI
Track 1
The Application of Predictive Policing with Police Helicopters
The National Police of The Netherlands has 8 police helicopters to assist law enforcement agencies all over the country. Helicopters are expensive resources, but their contribution to law enforcement is substantial. Therefore the aim is to allocate this resource as efficiently as possible. In this session we describe how predictive policing is applied to deploy police helicopters in The Netherlands
10:30-11:20am • Room: Independence A
Track 2
Enhancing Search Results Relevance Using Word2Vec Language Models
Learn how Sandia National Laboratories has applied neural network algorithms to enhance customer queries and improve the relevance of search results. In this case study, we will review our use of models such as Word2Vec to better understand and profile our unstructured content. We will discuss how our search application integrates these models with the Apache Solr search engine and describe how queries are improved with term expansion and phrase identification.
10:30-11:20am • Room: Franklin
Mini Course Technical Track
Building a Durable Data Foundation for an Analytical Environment
Experience shows that the typical Data Scientist spends well-over 30% of his/her time accessing and preparing data for use in research, model building and analysis. This session will introduce critical considerations for designing and building a sustained data and analytical environment, one that is designed to repeatedly and reliably provide storage and access to the data required for predictive analytics. The goal: developing an operating environment that enables Data Scientists to spend far less time pulling together the data, and more time extracting insight and meaningful information. Takeaways:1. Understanding the importance of specifying organizational needs, and how to do so 2. Foundational data and analytical environment design principles 3. The critical balance between capability development and discrete value creation.
Limited seating available. Priority will be given to government employees who sign up during the registration process - so register early!
[ Top of this page ] [ Agenda overview ]
11:25am-12:10pm • Room: Independence GHI
Track 1
Harnessing the Power of Predictive Analytics for Technology Risk Management
Organizations often face limited resources for managing their technology environment. In an effort to do more with less while focusing on the right risk, predictive analytics becomes a powerful tool for assessing risk associated with an organization's technology assets and informing decision-making. In this session, hear about how Fannie Mae has applied predictive analytics toward its technology risk management. Learn about the framework that was developed to apply organizational data toward risk-based models that measure application, infrastructure and change risk, and how these models enable proactive risk management and decision-making across Fannie Mae's technology organization.
11:25am-12:10pm • Room: Independence A
Track 2
Characteristics for Those Claiming Social Security Benefits Early
To determine which factors are associated with claiming Social Security benefits prior to the full retirement age, we developed a logistic regression model using the Health and Retirement Study (HRS) from 2000 to 2010. We found demographics and occupational characteristics, self-assessed health status, health insurance coverage, income and asset, education, self-assessed probability of life-expectancy exceed 75 years, full-time labor force status, and longevity of work - are significant factors in the multivariate model. Except the demographic and education attained, all other factors are measured at age between 60 - 62 years old - within two years of window before eligible.
11:25am-12:10pm • Room: Franklin
Mini Course Technical Track
Data Munging/Wrangling with R
One of the most time consuming steps in any analytics project is getting the data into a format that is suitable for analysis. "Data munging," or "data wrangling" as it is commonly called, is the process of cleaning, transforming and converting your data from its initial form into that which is necessary for modeling to occur. "R" is an open source statistical programming language commonly used for analyzing and visualizing data. Through R and its many available add-on packages you are provided a powerful means of slicing and dicing your data, no matter how dirty it may be, into the required format. In this mini-course, you will learn about the tools in R that make this process of data wrangling and munging more manageable.
Limited seating available. Priority will be given to government employees who sign up during the registration process - so register early!
[ Top of this page ] [ Agenda overview ]
12:10-1:00pm • Room: Independence Foyer
Lunch
1:00-1:45pm • Room: Independence A
KEYNOTE
Implementing Predictive Analytics at CMS: Lessons Learned and Future Directions
Dr. Shantanu Agrawal will share the experience of implementing the first predictive analytics system and program at the Centers for Medicare & Medicaid Services (CMS), to conduct real-time claims analytics. He will discuss the major lessons learned from the implementation, how to drive value from predictive analytics, and how to incorporate advanced analytics in business processes more broadly. The speaker will also discuss plans for continued development of the program at CMS.
 Dr. Shantanu Agrawal
Deputy Administrator for Program Integrity Director
Center for Program Integrity, Centers for Medicare & Medicaid Services (CMS)
1:45-2:30pm • Room: Independence A
PLENARY SESSION
Doing Space-Age Analytics with Our Hunter-Gatherer Brain
Predictive Analytics is so powerful and so useful – everywhere – we are astonished that its widespread adoption has taken so long. Its modest risk and phenomenal return should lead rational actors to cooperatively pool technical and domain expertise to tweak production processes to the benefit of all. And yet, most early projects fail to be implemented – felled by fear, pride, and ignorance.
But we can anticipate those foes! Recall that success requires solving three serious challenges: 1) Convincing experts that their ways can be improved, 2) Discovering new breakthroughs, and 3) Getting front-line users to completely change the way they work. No wonder there is resistance at every stage!
John argues that it's helpful to have a mental model of the human brain as not optimized for success in our modern life of safety and abundance, but for survival within a small tribal society. And that with this model we can better anticipate – and escape - the traps that we idealistic techno-nerds tend to blunder into as we try to bring life-changing fire into the tribal circle.
[ Top of this page ] [ Agenda overview ]
2:30-3:00pm • Room: Independence Foyer
BREAK
3:00-3:45pm • Room: Independence GHI
Track 1
Consumer Financial Protection Bureau: Understanding Consumer Experience in the Financial Products and Services Marketplace through Complaint Analytics
The Office of Consumer Response handles more than 20,000 consumer complaints each month. Bureau offices value complaint analyses to identify consumer harm, regulatory compliance, and to inform decision making. The Bureau needed a scalable solution to identify violations, trends, and insights in a continuously growing volume of complaint data. Deloitte provided an automated, open-source, text analytics solution to:
- Classify complaints by deciphering context and determining categories and classes from narrative text
- Apply rules-based and machine learning algorithms
- Merge structured and external data with these classifications to cluster like topics into complaint cohorts, identify patterns, and inform Bureau operations
3:00-3:45pm • Room: Independence A
Track 2
Towards Analytics Maturity in a Regulatory Agency
Electricity markets are complex. They are highly administered and operate on the back of vast data flows between many parties. The challenge confronting rule-makers is to make good policy decisions that keep pace with change and ensure that policy itself does not become a barrier to the operation of competitive markets. We use analytics to monitor and inform our policy decisions – but we also use analytics as a tool to facilitate participation and build confidence in the market arrangements. Confidence ensures regulatory certainty. This presentation shares experiences and lessons from our journey towards analytics maturity within a regulatory agency.
3:00-3:45pm • Room: Franklin
Mini Course Technical Track
How Do You Know When Your Model Is Good?
We all tend to think our newly-minted models are well-designed, based on expert knowledge, and acme's of predictive power. Experience, however, teaches us that models won't perform as well in production as their initial promise might indicate. This course will walk through the approaches we should take to model testing in order to have the best idea of how well they will perform in the real world, and to be confident that they will serve their purpose. Topics will range from hold-out test sets and cross-validation, to target shuffling and posterior predictive checks, as well as leaks from the future.
Limited seating available. Priority will be given to government employees who sign up during the registration process - so register early!
[ Top of this page ] [ Agenda overview ]
3:50-4:35pm • Room: Independence GHI
Track 1
Reducing Flight Delays Through Predictive Analytics
Domestic airline departure delays are estimated to cost the U.S. economy $32.9 billion annually. The Federal Aviation Administration's (FAA's) Traffic Flow Management System is used to strategically manage flights and applies simple heuristics to predict flight delays. In response to the limited predictive power of these heuristics, the FAA's NextGen Advanced Concepts and Technology Development Group started developing a predictive probabilistic model to improve aircraft departure time predictions. This new model would help the FAA understand the causes of departure delays and develop policies and actions to improve the reliability of departure time predictions for real-time traffic flow management.
3:50-4:35pm • Room: Independence A
Track 2
Predicting HIV Transmission Networks
We present predictive models to estimate the potential impact of a complex HIV intervention for the Botswana Combination Prevention Program (BCPP), a community based randomized HIV prevention trial. As HIV is a communicable disease, an individual's disease status is dependent on the individual's risk profile as well as the disease status and risk profile of other community members. During the presentation we will present a predictive analytic method developed to address these challenges in order to provide guidance for the BCPP trial design. We also will discuss an open source R package we developed to implement this framework.
3:50-4:35pm • Room: Franklin
Mini Course Technical Track
Data Visualization Even Your Boss Can Understand
You've invested in data infrastructure, put the best minds to work on analytics, and come up with amazing results. Don't let the analytics you've worked so hard to create fall on deaf ears! This mini course teaches practitioners how to effectively communicate analytic results using visualization. The course will study why visualization is a useful form of communication, teach practitioners the do's and don'ts of the trade, and examine a history of effective and ineffective examples from various fields.
Limited seating available. Priority will be given to government employees who sign up during the registration process - so register early!
[ Top of this page ] [ Agenda overview ]
5:10-6:10pm • Room: Independence Foyer
NETWORKING RECEPTION
Day 2, Tuesday, October 18, 2016 |
7:30-8:30am • Room: Independence Foyer
REGISTRATION
8:30-8:45am • Room: Independence Foyer
BREAKFAST
8:30-8:45am • Room: Independence A
Welcome Remarks
8:45-9:30am • Room: Independence A
KEYNOTEReinventing Refund Rhetoric: Using Predictive Analytics to Fight Fraud
South Carolina Department of Revenue Director Rick Reames will discuss how predictive analytics and enhanced technology is helping to combat tax refund fraud and strengthen information security.
[ Top of this page ] [ Agenda overview ]
9:30-10:05am • Room: Independence A
Roadmap to Analytics Excellence in Government
The public sector is increasingly embracing the idea of data driven government. But this new territory remains uncharted for many. This session offers cities, states and federal agencies a framework for thinking about how they can move along a four stage maturity model and achieve excellence in data-driven government. Examples of success include analytics use cases from cities in the Civic Analytics Network, a network of urban CDOs managed by Harvard Kennedy School.
 Jane Wiseman
Senior Fellow, Ash Institute for Democratic Governance and Innovation
Harvard University
10:05-10:30am • Room: Independence Foyer
BREAK
10:30-11:20am • Room: Independence GHI
Track 1
Words that Matter: Application of Text Analytics at the U.S. Commodity Futures Trading Commission
This session demonstrates how the U.S. Commodity Futures Trading Commission Office of the Inspector General partnered with an infrastructure services integrator to use text analytics to drive smarter decisions from unstructured data. Topics covered include: Business questions answered, success strategy, technique, results, and business application.
10:30-11:20am • Room: Independence A
Track 2
Infer and Characterize the Transmission Network in An Opioid-driven HIV-1 Outbreak
In January 2015, investigation of a sudden upsurge in new HIV-1 infections in a rural county in Indiana linked to injection drug use (IDU) identified a large outbreak (n=181). Here we describe the integration of epidemiologic and laboratory data to infer and characterize the transmission network. We apply a decision tree model to identify demographic and behavioral rules predictive of HIV status, which may inform decision making and human resource allocation during bloodborne outbreak investigations.
10:30-11:20am • Room: Franklin
Mini Course Technical Track
Network Analysis for Fraud Detection with Open-Source Tools
Although fraud or other bad behavior can occur at an individual level, in many contexts it is more illuminating to examine how individuals are connected and how their behavior appears from a network perspective. In this mini-course, we will introduce and demonstrate ways of using network analysis techniques to identify possible fraudulent or anomalous activity. Example code will be provided using the statistical programming language R and the network analysis package igraph.
Limited seating available. Priority will be given to government employees who sign up during the registration process - so register early!
11:25am-12:10pm • Room: Independence GHI
Track 1
Building a Highly Functioning Analytics Team
In 2014, the General Services Administration's Office of Human Resource Management (OHRM) established the Human Capital Analytics Division. Hear how this analytics division identified opportunities to help OHRM become more data-driven, worked through technical and data management challenges, and got management buy-in to drive better decisions. The Division's flagship product, an interactive workforce dashboard, will be demonstrated. Best practices and lessons learned will be shared, for federal agencies wishing to ramp up their analytics capabilities.
11:25am-12:10pm • Room: Independence A
Track 2
Expertise Identification with Data Analytics
The Analytics for Sandia Knowledge (ASK) Expertise Finder application is in its initial release. The system can be used for strategic staffing, visualization of expertise trends, and for identifying networks of collaborators using co-authorship information. The Expertise Finder application applies machine learning and natural language processing algorithms on information that is produced through normal work processes, so it is self-maintaining. It does not require manual entry, or maintenance, of skillsets for our employees. In this talk, we will describe the information used, the algorithmic techniques, and the challenges we faced building the ASK Expertise Finder application.
11:25am-12:10pm • Room: Franklin
Mini Course Technical Track
Data Visualizations with R and Shiny
Giving your analytics a "face" is one of the biggest and most important tasks in data science. Data visualization, also referred to as visual communication, is the clear and effective communication of data that hopefully leads to actionable, business outcomes. "R" is an open source statistical programming language that is equipped with a package called "Shiny", which allows you to build web applications without having prior knowledge of HTML, CSS, or javascript. R and Shiny provide a powerful way to visualize data at any phase of an analytics project. In this mini-course, you will learn how to build your own Shiny apps, understand "the why" Shiny, and understand when to use Shiny.
Limited seating available. Priority will be given to government employees who sign up during the registration process - so register early!
12:05-1:00pm • Room: Independence Foyer
LUNCH
1:00-1:45pm • Room: Independence A
KEYNOTEIARPA's Forecasting Tournaments
Over the last six years, IARPA has organized the world's largest forecasting tournaments to test methods for predicting foreign elections, treaty negotiations, disease outbreaks, political instability, weapons tests, cyber attacks, and a range of other events. These tournaments have collected and evaluated millions of forecasts, leading to breakthroughs in our understanding of global events, human judgment, risk and uncertainty.
1:45-2:30pm • Room: Independence A
PLENARY SESSION
Tax Fraud Analytics in Maryland -- The Evolution, Challenges, and Rewards
This session will focus on the incidence of tax refund fraud perpetrated against the federal and state governments and how Maryland is using data and analytics to combat fraud. We will focus on the evolution of data analytics at the Maryland Comptroller's office, the tools that are currently in use, the outlook for continued tax refund fraud, and opportunities that may exist to further combat this illicit activity.
2:30-3:00pm • Room: Independence Foyer
BREAK
3:00-3:45pm • Room: Independence GHI
Track 1
Link Analysis: A New Perspective for the IRS
The concept of link analysis is not new for the IRS. Every day investigators and agents follow leads, find connecting information, and expand their search accordingly. Whether it is locating a taxpayer, discovering associated business activity, or building a case, the IRS uses link analysis. However, current link analysis is done through manual investigations requiring days of research and numerous false leads. Data analysis is generally focused on single entities over a condensed amount of time. The office of Research, Applied Analytics and Statistics (RAAS) is working on an approach to shift the perspective of the IRS from a lead-based single entity approach to a data-driven network approach. RAAS is using graph databases to perform network analysis to offer a different way of viewing taxpayers and compliance activity.
3:00-3:45pm • Room: Independence A
Track 2
Identifying Prescription Drug Fraud and Abuse
Over 46,000 people died from a prescription drug overdose in 2014, of which 28,000 stemmed from opioid abuse. The epidemic has garnered Federal attention and there are many ongoing efforts to address the problem. One of these, is the Prescription Drug Monitoring Programs (PDMPs), state databases housing controlled substances that were filled at pharmacies. This presentation will demonstrate the power of applying of advanced analytic methods to PDMP data for the detection of specific classes of prescription fraud. We will show how we applied machine learning, geospatial filtering and graph analytics to identify the bad actors.
3:00-3:45pm • Room: Franklin
Mini Course Technical Track
Analytics with Apache Spark
Apache Spark provides a unified data pipeline platform that seamlessly transitions from exploratory data analysis to deployment. This mini-course will demonstrate how to create data flow and machine learning pipelines using real-world data. It is designed for those who want an introduction to the concepts, foundations and features of Apache Spark.
Limited seating available. Priority will be given to government employees who sign up during the registration process - so register early!
[ Top of this page ] [ Agenda overview ]
3:50-4:35pm • Room: Independence GHI
Track 1
Having a Data Science Mindset
Even non-technical government employees are looking to get into a "data science mindset." This talk draws on case studies from our most popular government and government contractor training module aimed at equipping even non-technical people with enough knowledge to "make them dangerous." These include lessons that even data scientists commonly get wrong, such as how human judgement is often systematically flawed, why humans are biologically wired by evolution to make poor gut decisions, and how data science can help us make better decisions. We'll delve into case studies using contemporary events like the 2008 stock market crash or the Vioxx drug approval scandal to understand some common simple mistakes even data scientists make and the limitations of data science.
3:50-4:35pm • Room: Independence A
Track 2
Advanced Analytics to Catch Sophisticated Fraudsters
Leveraging actual successful case studies, this session will demonstrate how to:
- Apply Exploratory Analytics to identify target areas
- Apply pre-pay analytics to detect fraud, waste, and abuse
- Apply analytics against managed care data
- Apply managed care findings into renegotiation of PM/PM capitated rates
- Migrate models into pre-pay rules to achieve cost avoidance
 Weishin Wang
Bureau Chief of the Bureau of Fraud Science and Technology
Illinois Department of Healthcare and Family services, Office of Inspector General
3:50-4:35pm • Room: Franklin
Mini Course Technical Track
Building Better Models Using Robust Data Mining Methods
Through case studies, you'll learn to build better models that don't over fit your data. Featured predictive analytic methods will include several types of regression, neural networks, and decision trees. Most importantly you will learn to randomly split your data into training, validation (tuning) and test subsets to prevent over fitting your data thus making your predictions more robust. You will learn how to use comparison techniques – both statistical as well as graphical - to find the best predictive model. Relative strengths, weaknesses and prediction accuracy of models are compared.
Limited seating available. Priority will be given to government employees who sign up during the registration process - so register early!
[ Top of this page ] [ Agenda overview ]


