
Here at FiveThirtyEight, we’ve never built a complete back-to-front model of the presidential primaries before. Instead, in 2008, 2012 and 2016, we issued forecasts of individual primaries and caucuses on piecemeal basis, using polls and demographics. We always thought there were too many complexities involved — how the outcome in one state can affect the next one, for example — to build a full-fledged primary model.
But this year, we’re giving it a shot. We’ve built a forecast that plays out the outcome of the 57 delegate-selection contests (50 states, D.C., five territories and Democrats Abroad) that Democrats will contest this year, simulating polling swings, post-primary “bounces” and candidates dropping out, starting with Iowa on Feb. 3 and ending with the Virgin Islands on June 6. We don’t try to anticipate what would happen in the event of a contested convention or if there are other complications in how delegates are chosen after June 6. But this is still a pretty ambitious project.
Why build a fancy primary model when we hadn’t before? Well, for one thing, there’s actually a lot more data available now than when we launched FiveThirtyEight 12 years ago. The Democratic primaries in 2008 and 2016, and the Republican ones in 2012 and 2016, were all long contests that give us more information on how the latter stages of the primary process play out. Since the current presidential nomination system is a relatively new invention — before 1972, voters had little direct say in how candidates were chosen — the data from these recent elections reduce the degree of difficulty in building a primary model. It’s still pretty hard, but it’s no longer an intractable problem.
Also, I suppose we’re feeling frisky these days. If building a full-fledged primary model presents its share of challenges — some of which I’ll describe here — there are also plenty of problems with publishing a half-assed forecasting product. (Meanwhile, trying to navigate our way through the primaries without any sort of forecasting product would present bigger challenges still.)
Before I run through the steps the model takes, here are a few key things to keep in mind. Even if you read nothing else about our model, please do read these. They’ll likely answer a few questions — or complaints — that you might have later on.
But it’s not as though we’re totally in the dark, either. Candidates who poll well in the run-up to the primaries are much more likely to win the nomination than those that don’t. If you hear things like “the primaries are unpredictable,” what does that mean, exactly? Does it mean that former Rep. John Delaney and author Marianne Williamson are as likely to win the nomination as Biden and Sen. Bernie Sanders? If that’s what you think, you know where to find me for a friendly wager.
In other words — like most things in life — the primaries exist somewhere along the spectrum between predictable and unpredictable. The model’s job is to sort all of this uncertainty out. And we encourage you to take probabilities we publish quite literally. A 60 percent chance of a candidate winning a particular state means that she’ll win it six out of 10 times over the long run — but fail to do so four out of 10 times. Historically, over 10 years of issuing forecasts, the probabilities that FiveThirtyEight publishes really are quite honest, i.e. our 60 percent probabilities really do occur about 60 percent of the time. With 57 primaries and caucuses to come, there will probably be some big upsets, and it’s likely that a candidate with a 5 percent chance or a 2 percent chance or even an 0.3 percent chance of winning a state will surprise us somewhere along the line.
Because of the path-dependent nature of the primaries — events in one state can affect the results in the next ones — the probability distributions our model generates can be pretty weird-looking. For instance, as of Jan. 7, here’s the range of possible outcomes that our model shows for Sanders in Ohio:
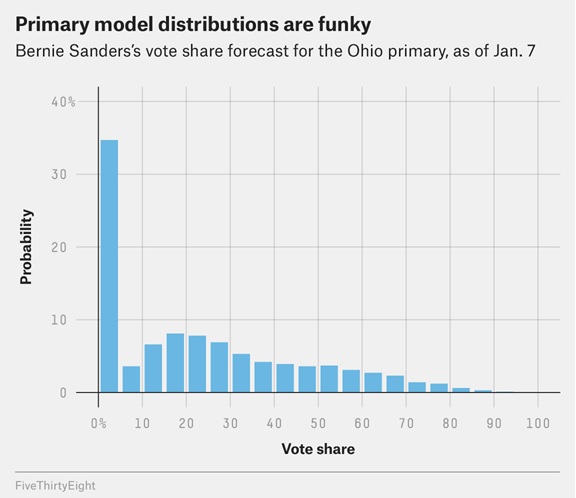
What’s going on here? Why the concentration of outcomes near zero percent? Those cases represent the chance — about one in three, our model figures — that Sanders will drop out at some point before Ohio. If he hasn’t dropped out at that point, Sanders figures to do decently well, on the other hand, most likely winning somewhere between 15 percent and 35 percent of the vote. But there’s also the chance that Sanders will be just one of two or three major candidates left by the time Ohio votes. If that’s the case, Sanders could win 50 percent or 60 percent of the vote there, or more. When you see the probabilities in our model, remember that they reflect this variety of possibilities.
To continue reading this article click here.
You must be logged in to post a comment.


Pingback: How Our Primary Model Works – Machine Learning Times – Rlogger
Pingback: How Our Primary Model Works – Machine Learning Times – NikolaNews